Three rides, five firmware versions, one breakthrough visualisation, and a magnet that spent an entire commute in my pocket. This weekend GearSense stopped being a pretty display and started being a system that can actually identify gears from real ride data.
Three rides, three lessons
Each of the weekend's rides taught something different. Not always the thing it was supposed to teach.
Mark II confirmed working on a real bike. BLE logging live. 13.2 minutes of data, 10,466 PAS pulses, 18,172 wheel pulses. The dominant gear cluster locked onto ratio 12.00 with a standard deviation of 0.254 — the tightest signal GearSense has ever produced. The hardware upgrade was worth it.
Moved the magnet closer to fix double-triggers. Made it worse. The intuition was reasonable — closer magnet, cleaner pulse. The result was the opposite. Lesson: the hardware isn't the problem. The algorithm needs to handle the sensor reality as-is, not the other way around.
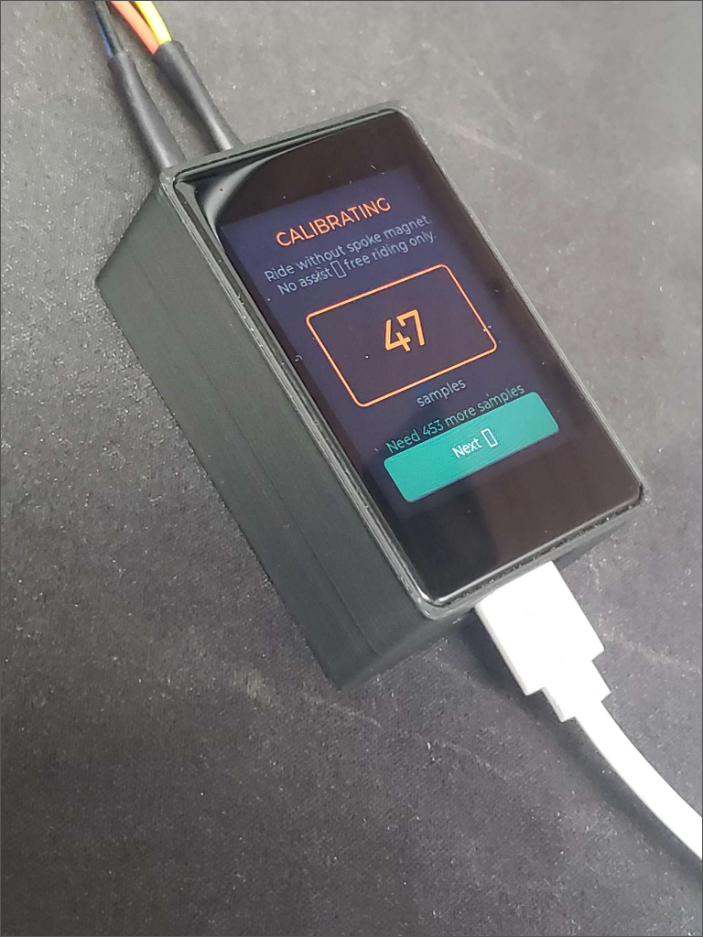
The magnet-in-pocket ride, then the breakthrough. Ride 3 produced nothing useful — the wheel magnet spent the commute in my jacket pocket instead of on the bike. Ride 4 was deliberate: four minutes unassisted, riding first through seventh gear. That section produced the staircase.
The interactive data explorer
The breakthrough didn't come from the firmware. It came from being able to see the data properly for the first time.
After the weekend's rides, a small web-based data explorer was built to visualise the logged CSV files in real time: a PAS cadence vs wheel speed scatter plot, and an instantaneous gear ratio plotted against time. Drag to pan, scroll to zoom. Nothing sophisticated — just enough to ask questions of the data.
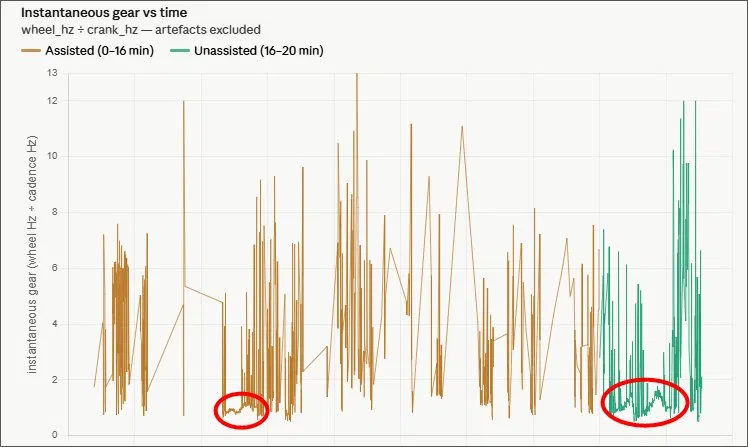
The key number the whole thing centres on:
When the unassisted section of Ride 4 was plotted — four minutes of first-through-seventh — the result was a staircase. Seven steps, one per gear, unmistakable. The scatter plot showed the same thing as seven distinct diagonal lines. Each gear: a constant ratio, with wheel speed and cadence varying together along it.
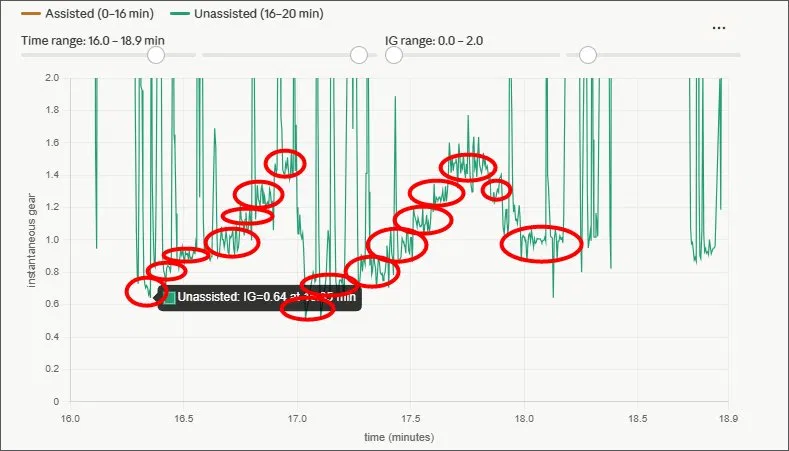
Seeing that staircase was the moment the algorithm stopped being a concept and became an engineering problem. We know what we're looking for. We know what it looks like. Now we build the thing that finds it reliably.
The two-regime discovery
The data explorer revealed something that wasn't obvious from first principles: the signal structure is fundamentally different depending on whether the motor is assisting.
Each gear produces a diagonal line on the scatter plot. Wheel speed and cadence both vary freely, but their ratio is constant. Clean, separable, algorithm-friendly. This is the signal to learn from.
The BAFANG controller governs wheel speed. Speed is held roughly constant; cadence varies by gear. The gear information is still encoded — just differently. Harder to cluster cleanly.
The implication is direct: learning rides should be done without assist. Unassisted = clean physics = clean gear signal. The algorithm doesn't need to handle both regimes during calibration. It only needs to handle the one where the signal is unambiguous.
Once calibration is complete and the gear map is locked, the system can apply it in both regimes during normal riding. But learning happens unassisted.
How the algorithm evolved
The naive approach — cluster everything, find peaks — doesn't survive contact with reality. Transitions between gears end up in the map. Double-triggers from the wheel magnet create phantom sub-ratios. Noise clusters pollute the result. What came out of this weekend is a three-layer approach that handles all of it.
-
01
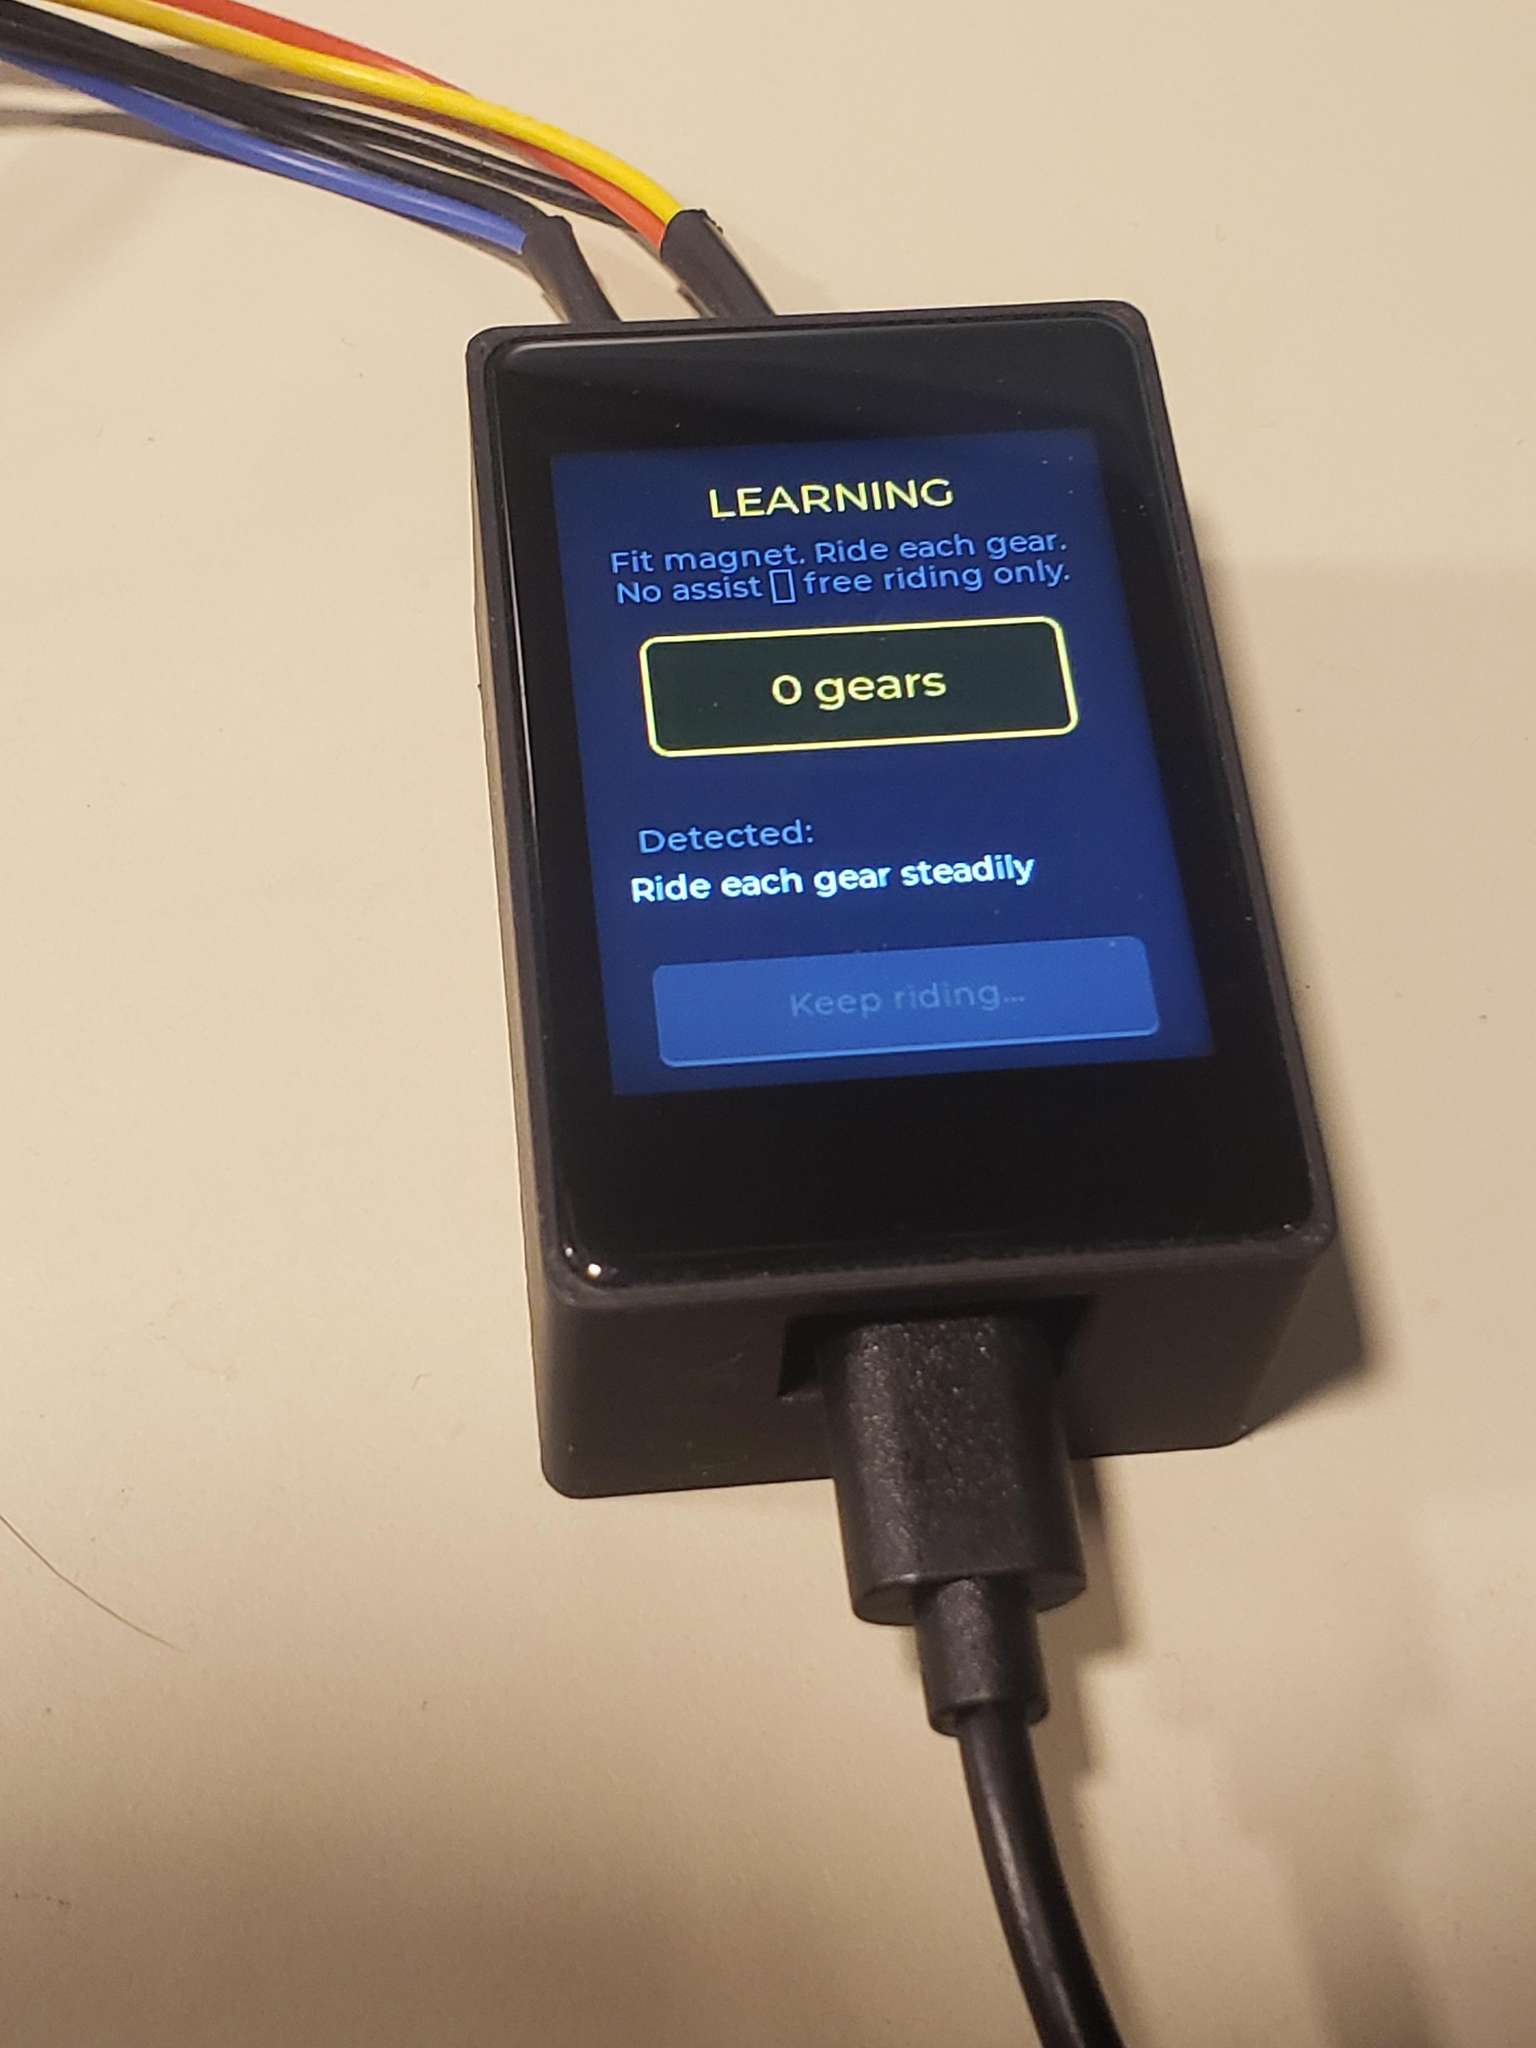
Flat-section clustering A rolling window watches the instantaneous gear signal. A gear candidate is only recorded when the reading has been stable for 8 or more consecutive samples. Gear changes, double-triggers, and noise spikes are all transient — they never accumulate 8 stable readings. Only rider-in-gear samples contribute to the gear map. Transitions are invisible to the algorithm.
-
02
Harmonic pattern recognition After clustering, the algorithm tries interpreting the candidate clusters at different strides: every cluster, every second cluster, every third. Each interpretation is scored against Shimano cassette spacing consistency, coverage of the expected gear count, and known gear ratios. The best-fitting interpretation wins. This handles double-triggers (which produce clusters at half the true spacing), any gear count, and makes no assumptions about the bike's drivetrain configuration.
-
03
Rider confirmation The algorithm proposes. The rider confirms. Each detected gear is shown as a horizontal bar on the Mark II screen — longer bar means higher ratio. Green means confident; amber means uncertain. The rider can tap to reject any gear that doesn't look right. The rider's own visual system becomes part of the ensemble. No algorithm knows a bike better than the person who rides it.
Looking ahead — rider profiling
The two-regime discovery came partly from thinking about how riding style changes — not just motor on vs off, but how a rider's own mechanics shift over time and circumstance. That question made it worth asking: what would GearSense actually see if the rider changed?
In RUNNING state — normal riding, after calibration — the firmware now accumulates cadence and speed statistics silently in the background. Ride after ride, it builds a profile of how this particular rider pedals on this particular bike. Effort distribution across the gears. Preferred cadence range. How that shifts on hills versus flats. The system already had all the data; it just needed to start keeping it.
This wasn't in the original design. It emerged from the hardware being on the bike and running. That's usually how the interesting features arrive.
Loading…